GIS' Role Responding to the Deepwater Horizon Spill
The use of Geographic Information Systems has become commonplace in preparing for and responding to natural and man-made disasters. Their ability to graphically impart information, and maintain it in near real-time, makes them a powerful tool for responding to evolving situations.
Multiple Local, State and Federal agencies are involved in monitoring both the ongoing spill, and the efforts to clean and protect sensitive environmental areas.
The Florida Fish and Wildlife Conservation Commission shows their usage of hand-held devices to map the spill in real-time.
They report back to Florida Department of Environmental Protection, the lead State agency for oil spill response. FDEP, in addition to implementing beach and boat patrols, also uses aerial reconnaissance, “The aerial teams are equipped with cameras that geocode the location of what are believed to be impacts from the oil spill.”
At the Federal level, the US Coast Guard has responsibility for near-shore areas. They are also using aircraft to locate oiled waters, and outlined the structure of their GIS environment in the following diagram.
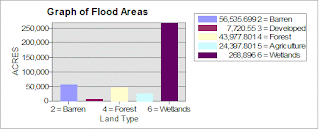
As well, NOAA is a lead Federal agency with responsibility to predict weather and water current patterns that will affect the movement of the over 45 Million barrels of oil, and also operates their Office of Response and Restoration. These missions rely heavily on GIS, as we learned in this weeks' exercise.
In a curious note, the single impediment to a Common Operating Picture for the responders has been British Petroleum, who has collected GIS data from Public agencies, but has refused to release it. Read this link for more information about BP's stranglehold on GIS data. Disgraceful and illegal.
http://2coolfishing.com/ttmbforum/showthread.php?t=282005


