Wednesday, June 30, 2010

Week 7 - So it goes


Hey mappers,

Why, with longer days, less gets done. I seem to have a 'Projection' issue...

Here is a killer Basemap. Then weird stuff happened; thought my 'attributes' would be around longer.


Had cool data for FEMA Flood Insurance (DFIRM_FLDHAZ), Base Flood Information (BFE), and the Special Flood Hazard Map (SFHA). Also, the Florida Department of Business & Professional Regulation csv delimited file of 'refreshment' establishments, and St Johns County horse riding areas helped define the target.

Criteria:
  • 50% - Above Flood Plain (BFE) - not in Egypt
  • 30% - Pony on the beach
  • 20% - 'What"s on tap?'
So you may just imagine the other features.


Wednesday, June 23, 2010

Week 6 Deliverables


Here is the limited amount of output I have for Week 6. Had little time and a whole lot of trouble with rasterizin'.

Saturday, June 12, 2010

Week 4 Participation Post


GIS' Role Responding to the Deepwater Horizon Spill

The use of Geographic Information Systems has become commonplace in preparing for and responding to natural and man-made disasters. Their ability to graphically impart information, and maintain it in near real-time, makes them a powerful tool for responding to evolving situations.
Multiple Local, State and Federal agencies are involved in monitoring both the ongoing spill, and the efforts to clean and protect sensitive environmental areas.
The Florida Fish and Wildlife Conservation Commission shows their usage of hand-held devices to map the spill in real-time.


They report back to Florida Department of Environmental Protection, the lead State agency for oil spill response. FDEP, in addition to implementing beach and boat patrols, also uses aerial reconnaissance, “The aerial teams are equipped with cameras that geocode the location of what are believed to be impacts from the oil spill.”

At the Federal level, the US Coast Guard has responsibility for near-shore areas. They are also using aircraft to locate oiled waters, and outlined the structure of their GIS environment in the following diagram.


As well, NOAA is a lead Federal agency with responsibility to predict weather and water current patterns that will affect the movement of the over 45 Million barrels of oil, and also operates their Office of Response and Restoration. These missions rely heavily on GIS, as we learned in this weeks' exercise.

In a curious note, the single impediment to a Common Operating Picture for the responders has been British Petroleum, who has collected GIS data from Public agencies, but has refused to release it. Read this link for more information about BP's stranglehold on GIS data. Disgraceful and illegal.

http://2coolfishing.com/ttmbforum/showthread.php?t=282005

Wednesday, June 9, 2010

Week 4 - Applications in GIS


In an effort to improve the visual aspect, here is Map 2 with an opaque landmass. I learned much respect for Projections and 'clever' solutions.


Here is Map 1, with the DRG basemap...


Week 3 Leftover


These lonely graphs didn't make the deadline for Week 3, but are stunning :)

Wednesday, June 2, 2010

Week Three - Applications in GIS


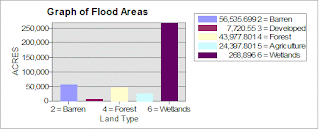
There seems to be an issue with my graphs, so here is the shotgun approach; something's gotta work...


Well, here are two jewels from my analysis of flooding on the Mississippi Coast from Hurricane Katrina.


Thursday, April 29, 2010

Intro Final Project - FPL Bobwhite - Manatee Line

Hi all. Here it is, my Analysis of Florida Power & Light's Bobwhite to Manatee project. It's electrifying.


Have a peaceful break and see you back in May.

Sky


Tuesday, April 6, 2010

Hiking Shavano - Week 11 in 3-D


VRML is cool! My holiday in Shavano was fun. We hiked, mapped and did general Z-based tasks. Without a shadow of a doubt, think I'm now a TIN man.

Listen to Mom - Reclass your Veggies - Week 11


Raster data has become more 'friendly'; we mesh more often. Reclassifying raster data to allow analysis has opened more opportunities for a 'vector' guy. Are the poly's gone?

I chose classification colors that were more 'natural'. I struggle with the 'no-data' category - seems it should be de-emphasized, but this looks awkward.

Model Builder orbs - Week 11


Model Builder is great! Drag and drop macros allow iterative analysis without distracting tool selection (especially for informing casual decision makers).

Recreation Areas - Week 11


Here are a collection of Recreation Areas surrounding Tampa Bay. I've my canoe on the truck... Let's paddle!

I was unsure of the extent to show, as the Withlacooc Hee looks interesting, but makes for a scale that looses the labeling.

Cities & Roads - Week 11


Here are the Cities & Roads data, with Cities and Roads; really. Label Manager is a powerful tool; I've only used Attributes before.

Sunday, March 21, 2010

Map of Recreation Areas


Here are the proposed recreation areas that do not encroach on sensitive areas and are accessible by road. They are also in close proximity to water (but you might want to boil it). I used the Clip Tool to locate the Preserve areas that overlapped the recreation areas ( just for my assistance), then added a binary field to the Preserve layer and set it to 1. Then used Union to combine Preserve with buffer_union_single and Selected all records not having the Preserve bit set.The Tool output was as expected (love those spatial tools!). I had 79 features in the output layer. The smallest was 5656 sq meters, the largest 8055502.

Tuesday, March 16, 2010

Gulf County Florida Property Tax Parcels


Here is Gulf County Florida. Most of the land is owned by a few entities, a surprising concentration of resources. This was a straight forward assignment.

Wednesday, March 3, 2010

Week 7 UWF Campus Data Editing


This map shows several additions and corrections to existing layers, and a new layer for Athletic Fields. The editing functions were straightforward (once Sean C. helped me interpret the Lab instructions :). The ESRI Course made life easy!

Friday, February 26, 2010

Week 6 Georeferenced Map of UWF


This is a georeferenced map of the beautiful University of West Florida campus.Two aerial images are coaxed to agree with coordinated data. The North image required 18 control points, to achieve an error of 9.70094. The South image required 48 links, to achieve an error of 8.9088 for the third order polynomial. Amber's office is near the big tree, you can see her waving at the satellite (if you look very closely).

Sunday, February 21, 2010

Week 5 - Florida Map 3


It is raster, remote and remedial; but it's here! DRG, DEM and DOQQ. Unzipped and unplugged. I am mildly surprised the roads and water courses actually coincide with the DEM.

Week 5 - Florida Map 2


This map reflects the extensive Land Cover for Washington County. Features with a 'count' of less than 2000 were removed to simplify the overall presentation. 'Count' is difficult to quantify, as I tried classifying the data, and the mean was 30?

Roads were included as base data for observer orientation. City names have a 'Halo' for visibility. The most challenging issue was finding Land Cover by County, as Statewide data requires hours to clip...

Week 5 - Florida Map 1


This map shows vector data for Washington County Florida. There are few cities/towns in this area, substantial wetlands (including bogs and swamps), and a road network that avoids wetlands. Public lands are identified as well.

I was surprised to see how much of the wetlands were not associated with the hydrography polygons.
The major challenge was querying the wetlands layer to eliminate redundancy with lakes, rivers and other hydrography entities.

Wednesday, February 17, 2010

Animated Map of Unemployment by County

Interesting animated map of changing unemployment rates. My wife (a map widow) forwarded this to me :) Thank you Jeanie!

I had to shrink the size of the Flash window to fit the blog format, so the legend text is no longer legible. If I get a chance, I'll clean it up... You get the idea anyway, how elapsed time can be displayed. Cool, eh?

http://cohort11.americanobserver.net/latoyaegwuekwe/multimediafinal.html

Updated: Friday, February 5, 2010 at 3:20 pm. Now available on YouTube. Click here.

Wednesday, February 10, 2010

How Map Projection affects Area Calculations

So, this project interprets four Counties in Florida, and how the choice of Map Projections changes the calculated area for each. The area is in square miles. Text was challenging to format, as Arc is using a proportional spaced font. Almost made me like Adobe Illustrator :)

Sunday, January 31, 2010

Elevation Map for Week 3 - Stretched raster

Here is the third map for week 3. It uses a raster layer, with elevation indicated by darker color. Sort of a parallel to ocean depth maps (deeper water is darker). I prefer the Stretched presentation for its visual impact; Classified is fine for statistical analysis, but the gradations are too severe, visually.
Here is my second map for week 3. I am not used to selecting attributes in the Symbology tab; more likely to select them from the tables, instead of having a bazillion (yes, that's a number) entities to deal with. That's part of what I find enjoying; there really are many ways to do approach the same goal.
This map is too busy; I messed with colors and line thickness, and am still not excited. The population centers are so small, relative to the scale of 1:5000000.

Here is my first map for Week 3. The color gradation seems to work for population density = darker shades.No major problems with this one.

Thursday, January 28, 2010

Sunday, January 17, 2010

Youth Center Locations

Somewhat more challenging, especially with the optimal sites being widely dispersed. Labels and symbols need to be larger.

I've not played with templates before; slick, but I would create my own that's more attractive, and has a key.

Unions, intersects and such are interesting... Probably should have done proximity to sex-offenders too.

San Diego

This assignment was fairly straightforward. I selected the hotel, light rail stations and destinations from the attribute tables and created new layers to decrease visual clutter. I actually have been a guest at this hotel for the Fire House World conference... Highly recommend the Gas Light District for pubs and food.

Thursday, January 7, 2010

Intro to GIS at UWF

Hello classmates, instructors and curious passers-by.